Exploring Different Types of Maps: A Comprehensive Guide
Maps have been an essential part of human civilization for centuries, serving as guides in both our daily routines and grand expeditions.
Whether it's a street map helping us find a new restaurant in our city or a topographic map aiding explorers in charting uncharted territories, maps provide us with a sense of direction and purpose.
In our modern, fast-paced world, maps have become even more crucial. With the advent of smartphones and GPS technology, maps are now readily available at our fingertips, revolutionizing how we navigate and plan our journeys. Commuters rely on maps for real-time traffic updates, while travelers use them to explore new destinations efficiently. Maps have truly become indispensable in our daily lives.
The Diversity of Map Types and Their Importance
The diversity of map types is awe-inspiring. From simple sketches on ancient scrolls to complex digital representations, maps have evolved tremendously, adapting to our changing needs and technological capabilities.
These variations in map types cater to an array of purposes, encompassing geographical, political, environmental, and even psychological aspects.
Every map type has its unique significance.
Political maps help us understand the political makeup of the world, displaying borders, capitals, and territories. Physical maps, on the other hand, unveil the Earth's natural features such as mountains, rivers, and forests.
Each type of map serves a specific purpose, enabling us to comprehend different aspects of our world in detail.
Let’s delve into some of the most common types of maps, studying their characteristics, applications, and intricacies, with emphasis on specialized map categories, map projections, the role of cartography, and addressing common questions related to map types.

Types of Maps: An Overview
Maps, at their core, are visual representations of spatial information. They offer a way to depict the world around us, providing a simplified view that aids in understanding its complexity.
The purposes of maps are as diverse as the information they represent. Some are meant for navigation, helping us find our way, while others focus on displaying geographic or socio-political data.
Maps have transcended their original purpose of providing directions. Today, they are invaluable tools for various disciplines.
Urban planners use maps to design cities, epidemiologists employ them to track disease outbreaks, and historians rely on maps to study the evolution of civilizations.
The versatility of maps lies in their adaptability to different needs and their ability to communicate information effectively.
Different Categories of Maps
Maps can be broadly categorized into three types based on their primary purpose and the kind of information they convey. These categories encompass general purpose maps, cartometric maps, and thematic maps:
General Purpose Maps
General purpose maps, also known as reference maps or base maps, are comprehensive representations of geographic features and locations.
These maps serve a wide range of general informational needs and typically display a variety of features, such as cities, countries, rivers, mountains, roads, and other physical and human-made elements of the Earth's surface.
They aim to provide an overall understanding of the geographical layout and context of a particular area. General purpose maps are commonly used for orientation, navigation, educational purposes, and gaining a broad understanding of geographic relationships.
Cartometric Maps
Cartometric maps focus on accurately representing the geometric properties of geographic features on the Earth's surface. These maps emphasize precise measurements, dimensions, and spatial relationships, with an emphasis on accuracy in scale, distance, angles, and shapes.
Cartometric maps are critical for applications like engineering, urban planning, architecture, and various scientific analyses that require highly accurate spatial information.
They often involve specialized projection techniques to preserve accurate measurements and geometry when representing the three-dimensional Earth on a two-dimensional map.
Thematic Maps
Thematic maps are designed to represent specific themes or subjects related to geographic data or statistical information.
These maps display data about a particular topic, such as population distribution, climate patterns, economic indicators, land use, or any other subject of interest.
Thematic maps use various visual elements like color, patterns, symbols, or choropleth techniques to represent the data spatially and provide insights into patterns, trends, or distributions related to the chosen theme.
Thematic maps are essential for conducting specialized studies, research, and policy planning in fields such as sociology, environmental science, economics, public health, and more. They help in analyzing and communicating complex data in a clear and understandable way.
The Role of Maps in Visualizing Information and Data
Maps are unparalleled tools for visualizing complex information and data in a digestible format. By converting vast datasets into visual representations, maps facilitate a quicker understanding of patterns, trends, and relationships.
Whether it's a heat map showcasing population density or a choropleth map indicating education levels, maps simplify intricate data for easy interpretation.
Moreover, maps aid in spatial analysis, allowing us to detect spatial patterns and make informed decisions based on location-specific information.
The visual nature of maps enhances our ability to process information, making them indispensable for researchers, policymakers, and everyday individuals.
Exploring Common Types of Maps
We’ve already discussed the different types of maps and how they help us visualize valuable information. Let’s take a deeper look into each type of map and what they can be useful for.
Political Maps
Political maps are fundamental in understanding the geopolitical landscape of the world. They provide a clear representation of countries, states, capitals, and other administrative divisions.
Colors and symbols are employed to differentiate between nations, making it easier to comprehend political boundaries.
In addition to countries and states, political maps often display major cities, bodies of water, and sometimes key landmarks.
This comprehensive view aids travelers, students, and researchers in gaining insights into global and regional political dynamics.
Example: A political map of Europe, vividly displaying the distinct countries with different colors. Borders are marked, and major cities like Paris, London, and Berlin are clearly labeled. Such a map offers a quick overview of the political makeup of the continent.
Street Maps
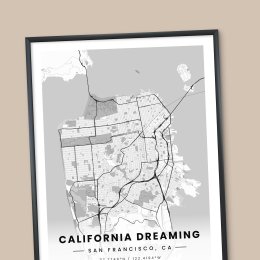
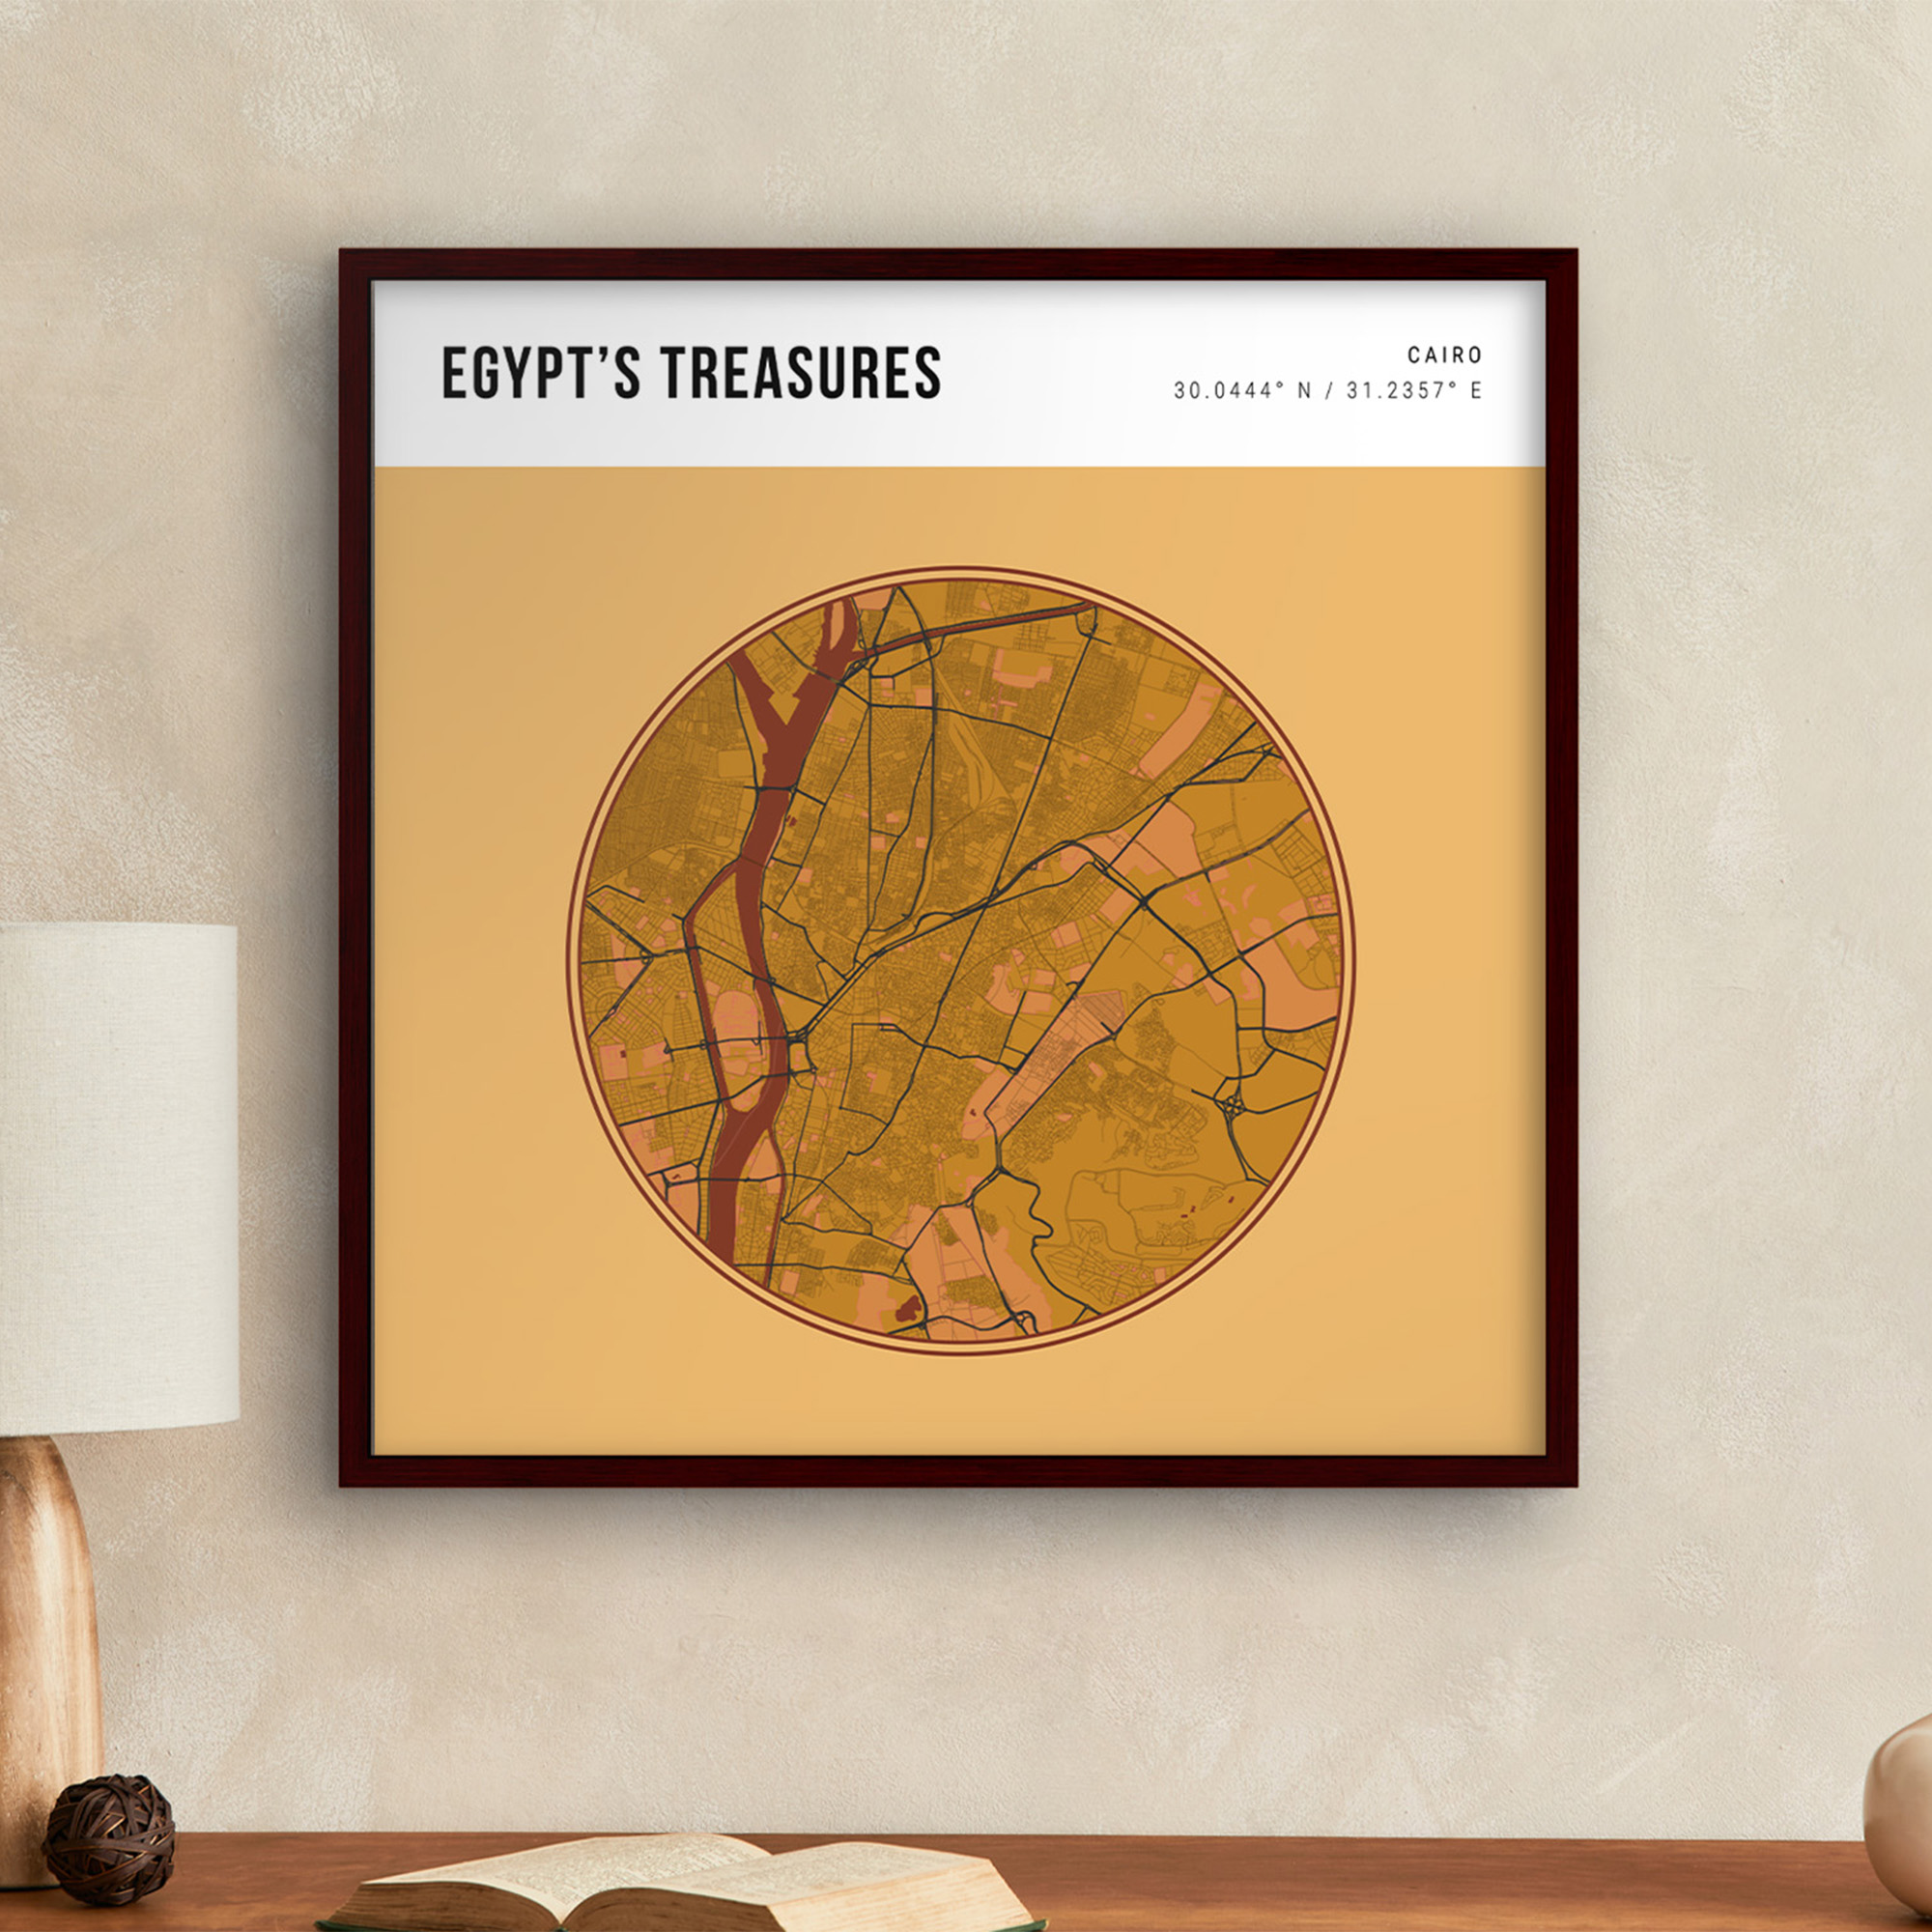
Street maps are detailed visual representations of urban and suburban areas, illustrating roads, streets, highways, intersections, and other elements of the transportation network.
They use lines, labels, and symbols to indicate streets, landmarks, points of interest, and geographical features, facilitating navigation and orientation within a city or town.
Street maps are invaluable tools for commuters, tourists, and emergency services, aiding in efficient travel, locating addresses, and understanding the layout of a specific area.
Example: A street map of New York City, showcasing its intricate network of streets and avenues, highlighting major landmarks like Central Park, Times Square, and the Empire State Building, allowing for easy navigation and exploration of the city.

Physical Maps
Physical maps offer a glimpse into the natural features of the Earth's surface. They showcase mountains, plains, deserts, oceans, lakes, and rivers, providing an understanding of the planet's diverse geography.
Colors and shading techniques are used to distinguish between different landforms and bodies of water.
Physical maps are essential for environmentalists, geographers, and outdoor enthusiasts, helping them study ecosystems, plan expeditions, and appreciate the Earth's beauty.
Example: A physical map of North America, showcasing the vast Rocky Mountains, the expansive Great Plains, the mighty Mississippi River, and the vast Pacific Ocean. Shades of green represent forests, while shades of blue depict water bodies. This map paints a vivid picture of the continent's geographical diversity.
Topographic Maps
Topographic maps are detailed representations of the Earth's surface, illustrating elevations, land contours, and geographic features. These maps are instrumental for hikers, engineers, and land developers, aiding them in understanding the terrain and planning construction projects.
Contour lines on topographic maps represent changes in elevation, enabling readers to visualize slopes and valleys.
Additionally, topographic maps showcase human-made structures like roads, buildings, and infrastructure, offering a comprehensive view of both the natural and built environment.
Example: A topographic map of a popular hiking trail in the Appalachian Mountains. Contour lines crisscross the map, indicating the elevation changes and steep sections of the trail. Peaks and valleys are clearly marked, giving hikers a sense of the trail's terrain.
Star Maps
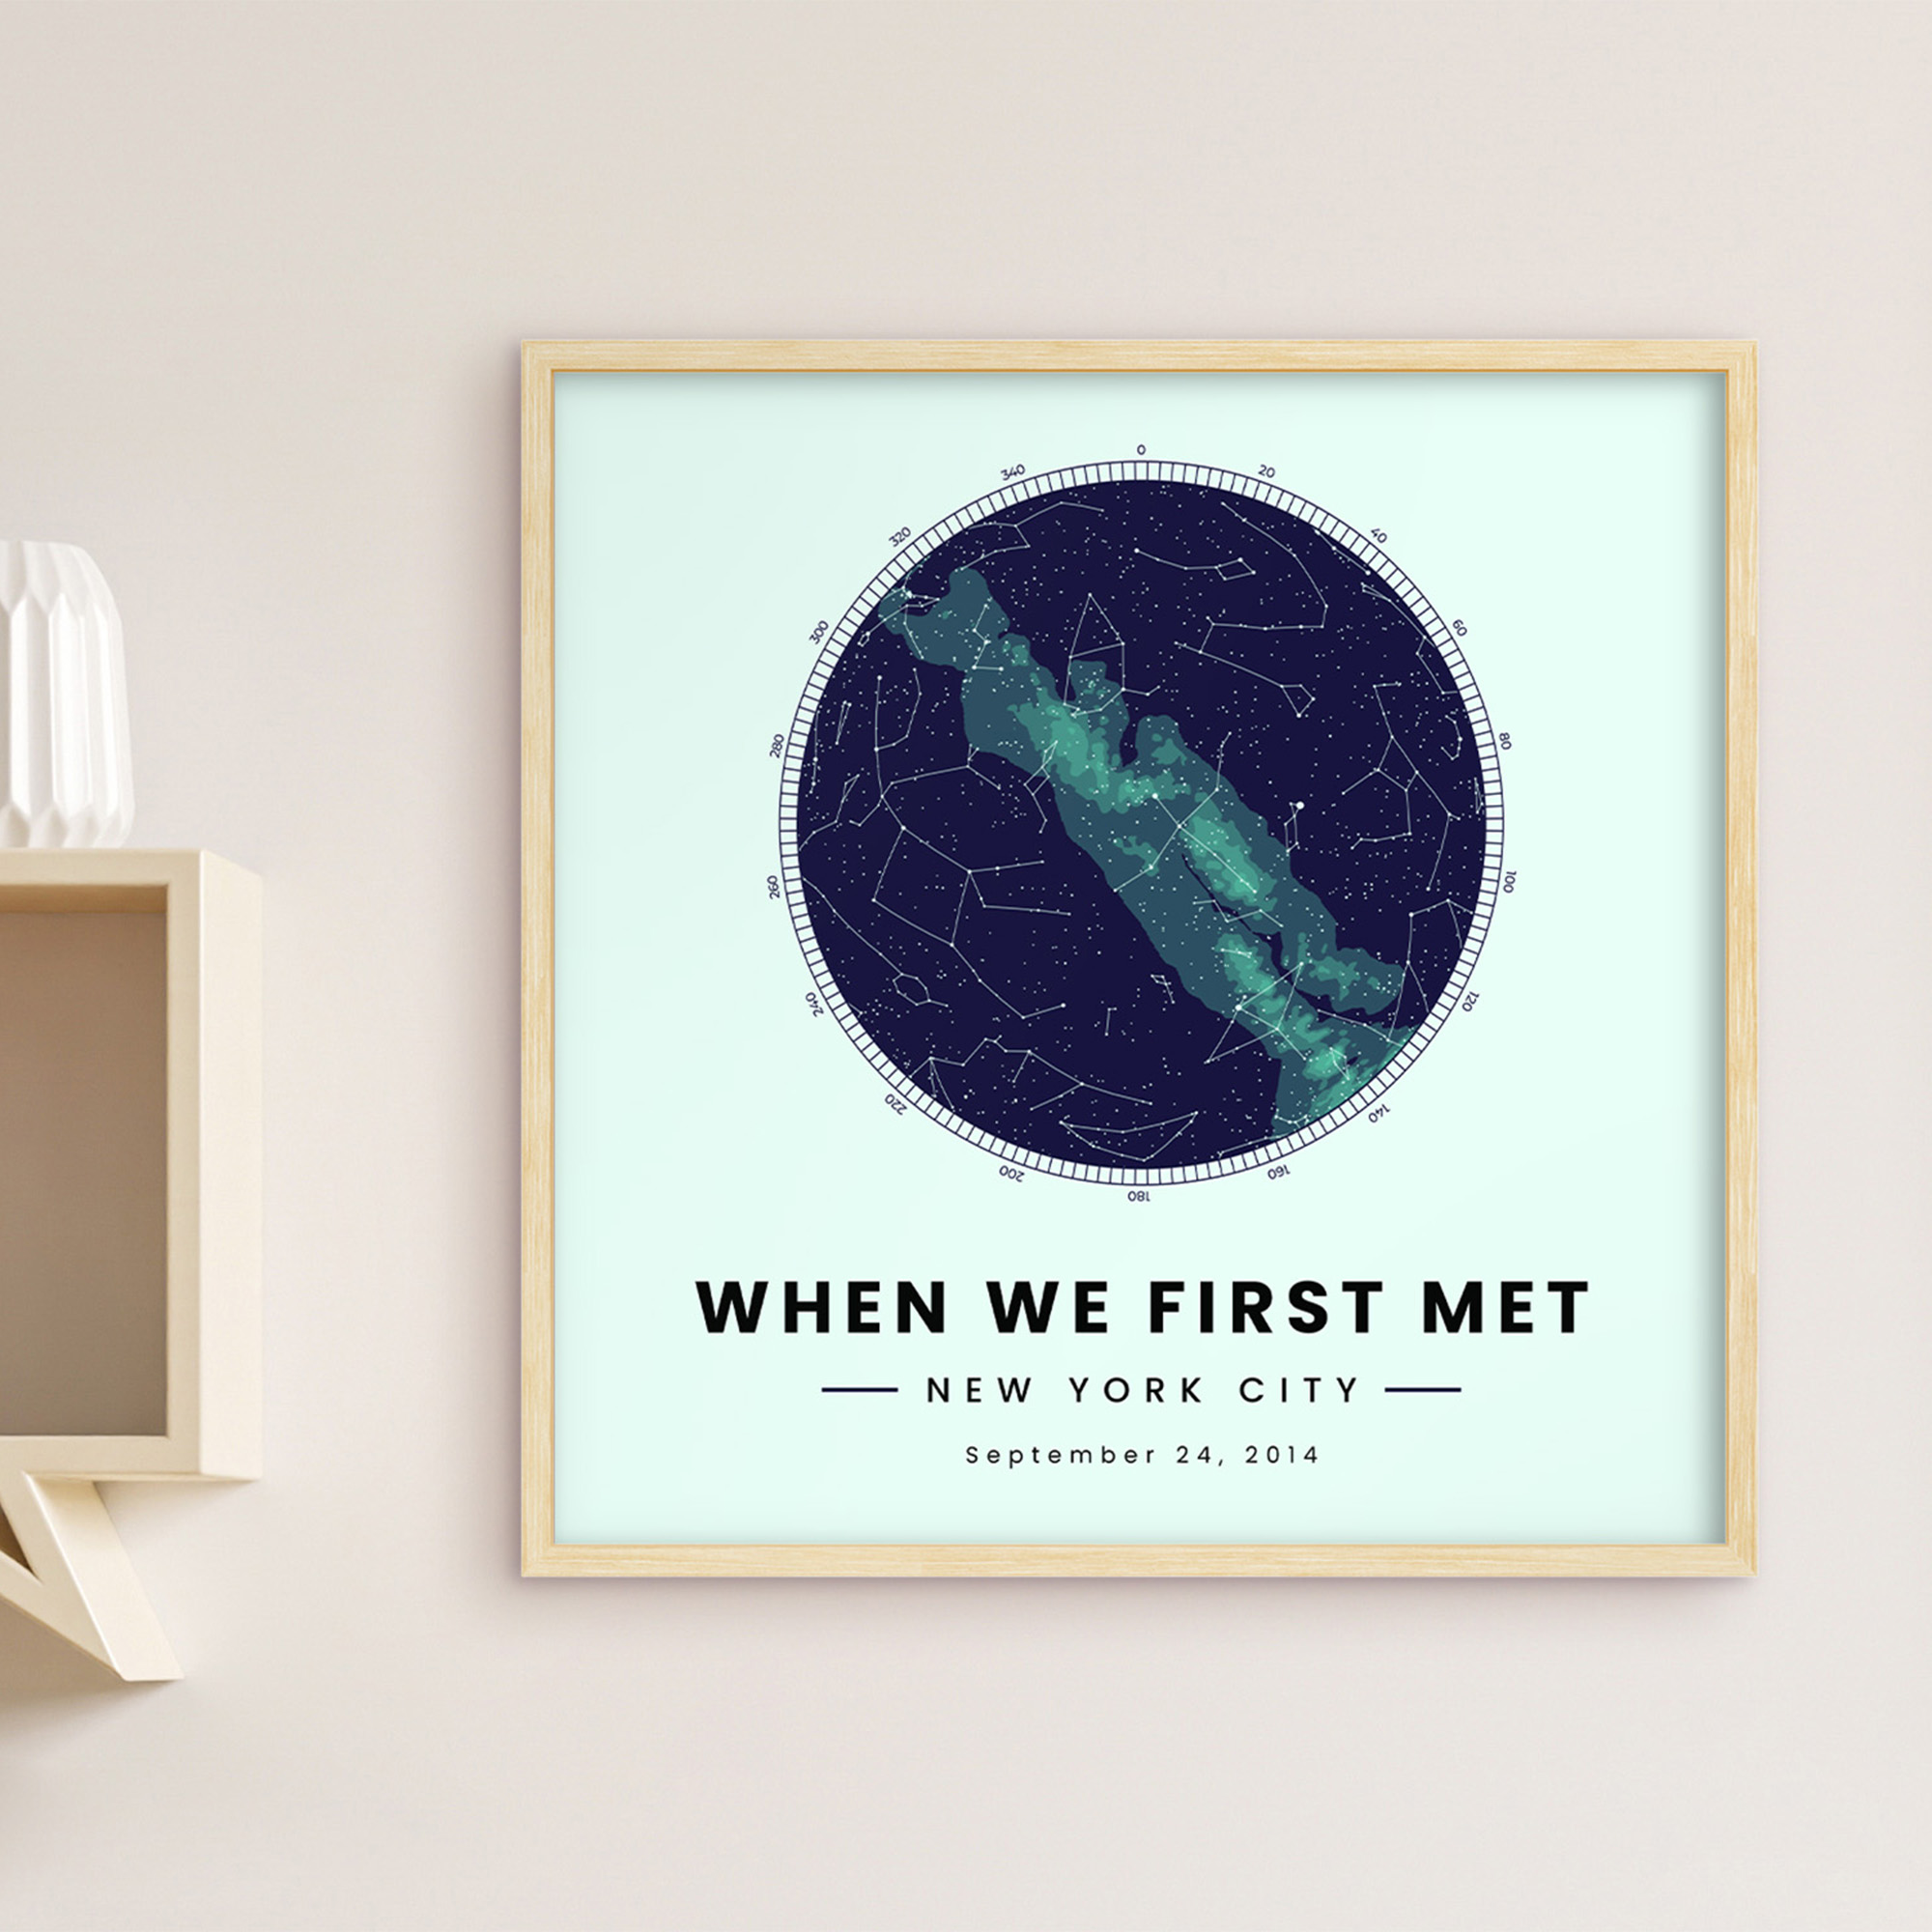
Star maps, also known as celestial maps or star charts, provide a visual representation of the arrangement and positions of celestial objects such as stars, planets, constellations, and other celestial bodies in the night sky.
They utilize symbols, lines, and labels to denote the relative positions and brightness of stars, helping astronomers, stargazers, and navigators navigate the night sky and locate specific celestial features.
Example: A star map showcasing the constellations and major stars visible in the night sky during a particular day. The map uses different symbols to represent stars, and lines connect them to outline the constellations, aiding observers in identifying these formations during their stargazing endeavors.
Climate Maps
Climate maps present climatic data in a visually accessible format, allowing us to understand weather patterns and variations across different regions.
They use colors, patterns, and legends to denote temperature, precipitation, humidity, wind patterns, and more.
Climate maps are indispensable for meteorologists, climate scientists, and researchers studying weather phenomena. These maps aid in climate modeling, disaster preparedness, and formulating policies related to climate change and environmental sustainability.
Example: A climate map of the world, color-coded to represent varying temperature zones. Warmer regions near the equator are in shades of red, while colder polar areas are in shades of blue. This map visually communicates global temperature patterns.
How Each Type of Map Serves Specific Informational Needs
Understanding how each type of map serves specific informational needs is crucial to utilizing them effectively. Political maps, for instance, provide essential knowledge about political boundaries and international relations. They help us understand how nations are organized and interact on a global scale.
Physical maps, on the other hand, provide insights into the Earth's natural beauty and diversity. By showcasing mountains, rivers, and landscapes, they give us a glimpse of the planet's geographical intricacies.
Topographic maps cater to the needs of outdoor enthusiasts, hikers, and engineers. They offer vital information about elevations, slopes, and geographic features, assisting in safe navigation and construction planning.
Climate maps, with their depiction of weather patterns and climatic conditions, are invaluable for meteorologists and climate scientists. They aid in forecasting, analyzing climate trends, and planning for extreme weather events.
Beyond the Basics: Specialized Map Categories
Specialized maps cater to specific domains and industries, offering detailed insights and aiding professionals in their respective fields.
These maps provide a deeper understanding of particular subjects and are designed to meet the unique requirements of specialized analyses.
Specialized maps can really be about anything; they could focus on population distribution or other demographic data, or they could follow economic indicators in certain areas.
But if you want to make a map for fun, your specialized map may not have anything to do with population density or GDP. Let’s take a closer look at how thematic maps work.
Types of Thematic Maps and Their Unique Purposes
Thematic maps, a subset of specialized maps, focus on a particular theme or subject. They are designed to communicate specific information related to that theme effectively. Thematic maps come in various forms, each serving a unique purpose.
Some examples of thematic maps include:
- Choropleth Maps: Choropleth maps use color variations or shading to represent data values for specific geographic areas, such as countries, states, or regions. The intensity of color indicates the magnitude of the variable being portrayed. These maps are ideal for illustrating population density, literacy rates, or any data that can be categorized.
- Dot Distribution Maps: Dot distribution maps use dots to represent individual occurrences or events within a geographic area. Each dot might represent a certain number of occurrences, making it easy to visualize patterns and concentrations. Dot distribution maps are useful for displaying points of interest, such as crime incidents, disease outbreaks, or store locations.
- Isoline Maps: Isoline maps use lines to connect points of equal value, such as temperature or elevation. These lines, called isolines, create a contour map, offering a smooth transition between different values. Isoline maps are valuable for representing continuous data, making them suitable for temperature, rainfall, or elevation data.
- Cartograms: Cartograms are unique thematic maps where the size or shape of geographic regions is distorted based on a particular variable. For example, if the variable is population, regions with higher populations might appear larger. Cartograms provide an unconventional yet effective way of visualizing data, highlighting variations based on the chosen variable.
Map Projections and Their Impact on Cartography
Map projections are mathematical techniques used to represent the three-dimensional Earth's surface on a two-dimensional map. As the Earth is a curved surface, it's impossible to accurately project it onto a flat plane without some distortion. But cartographers go around that little issue by employing different kinds of projections.
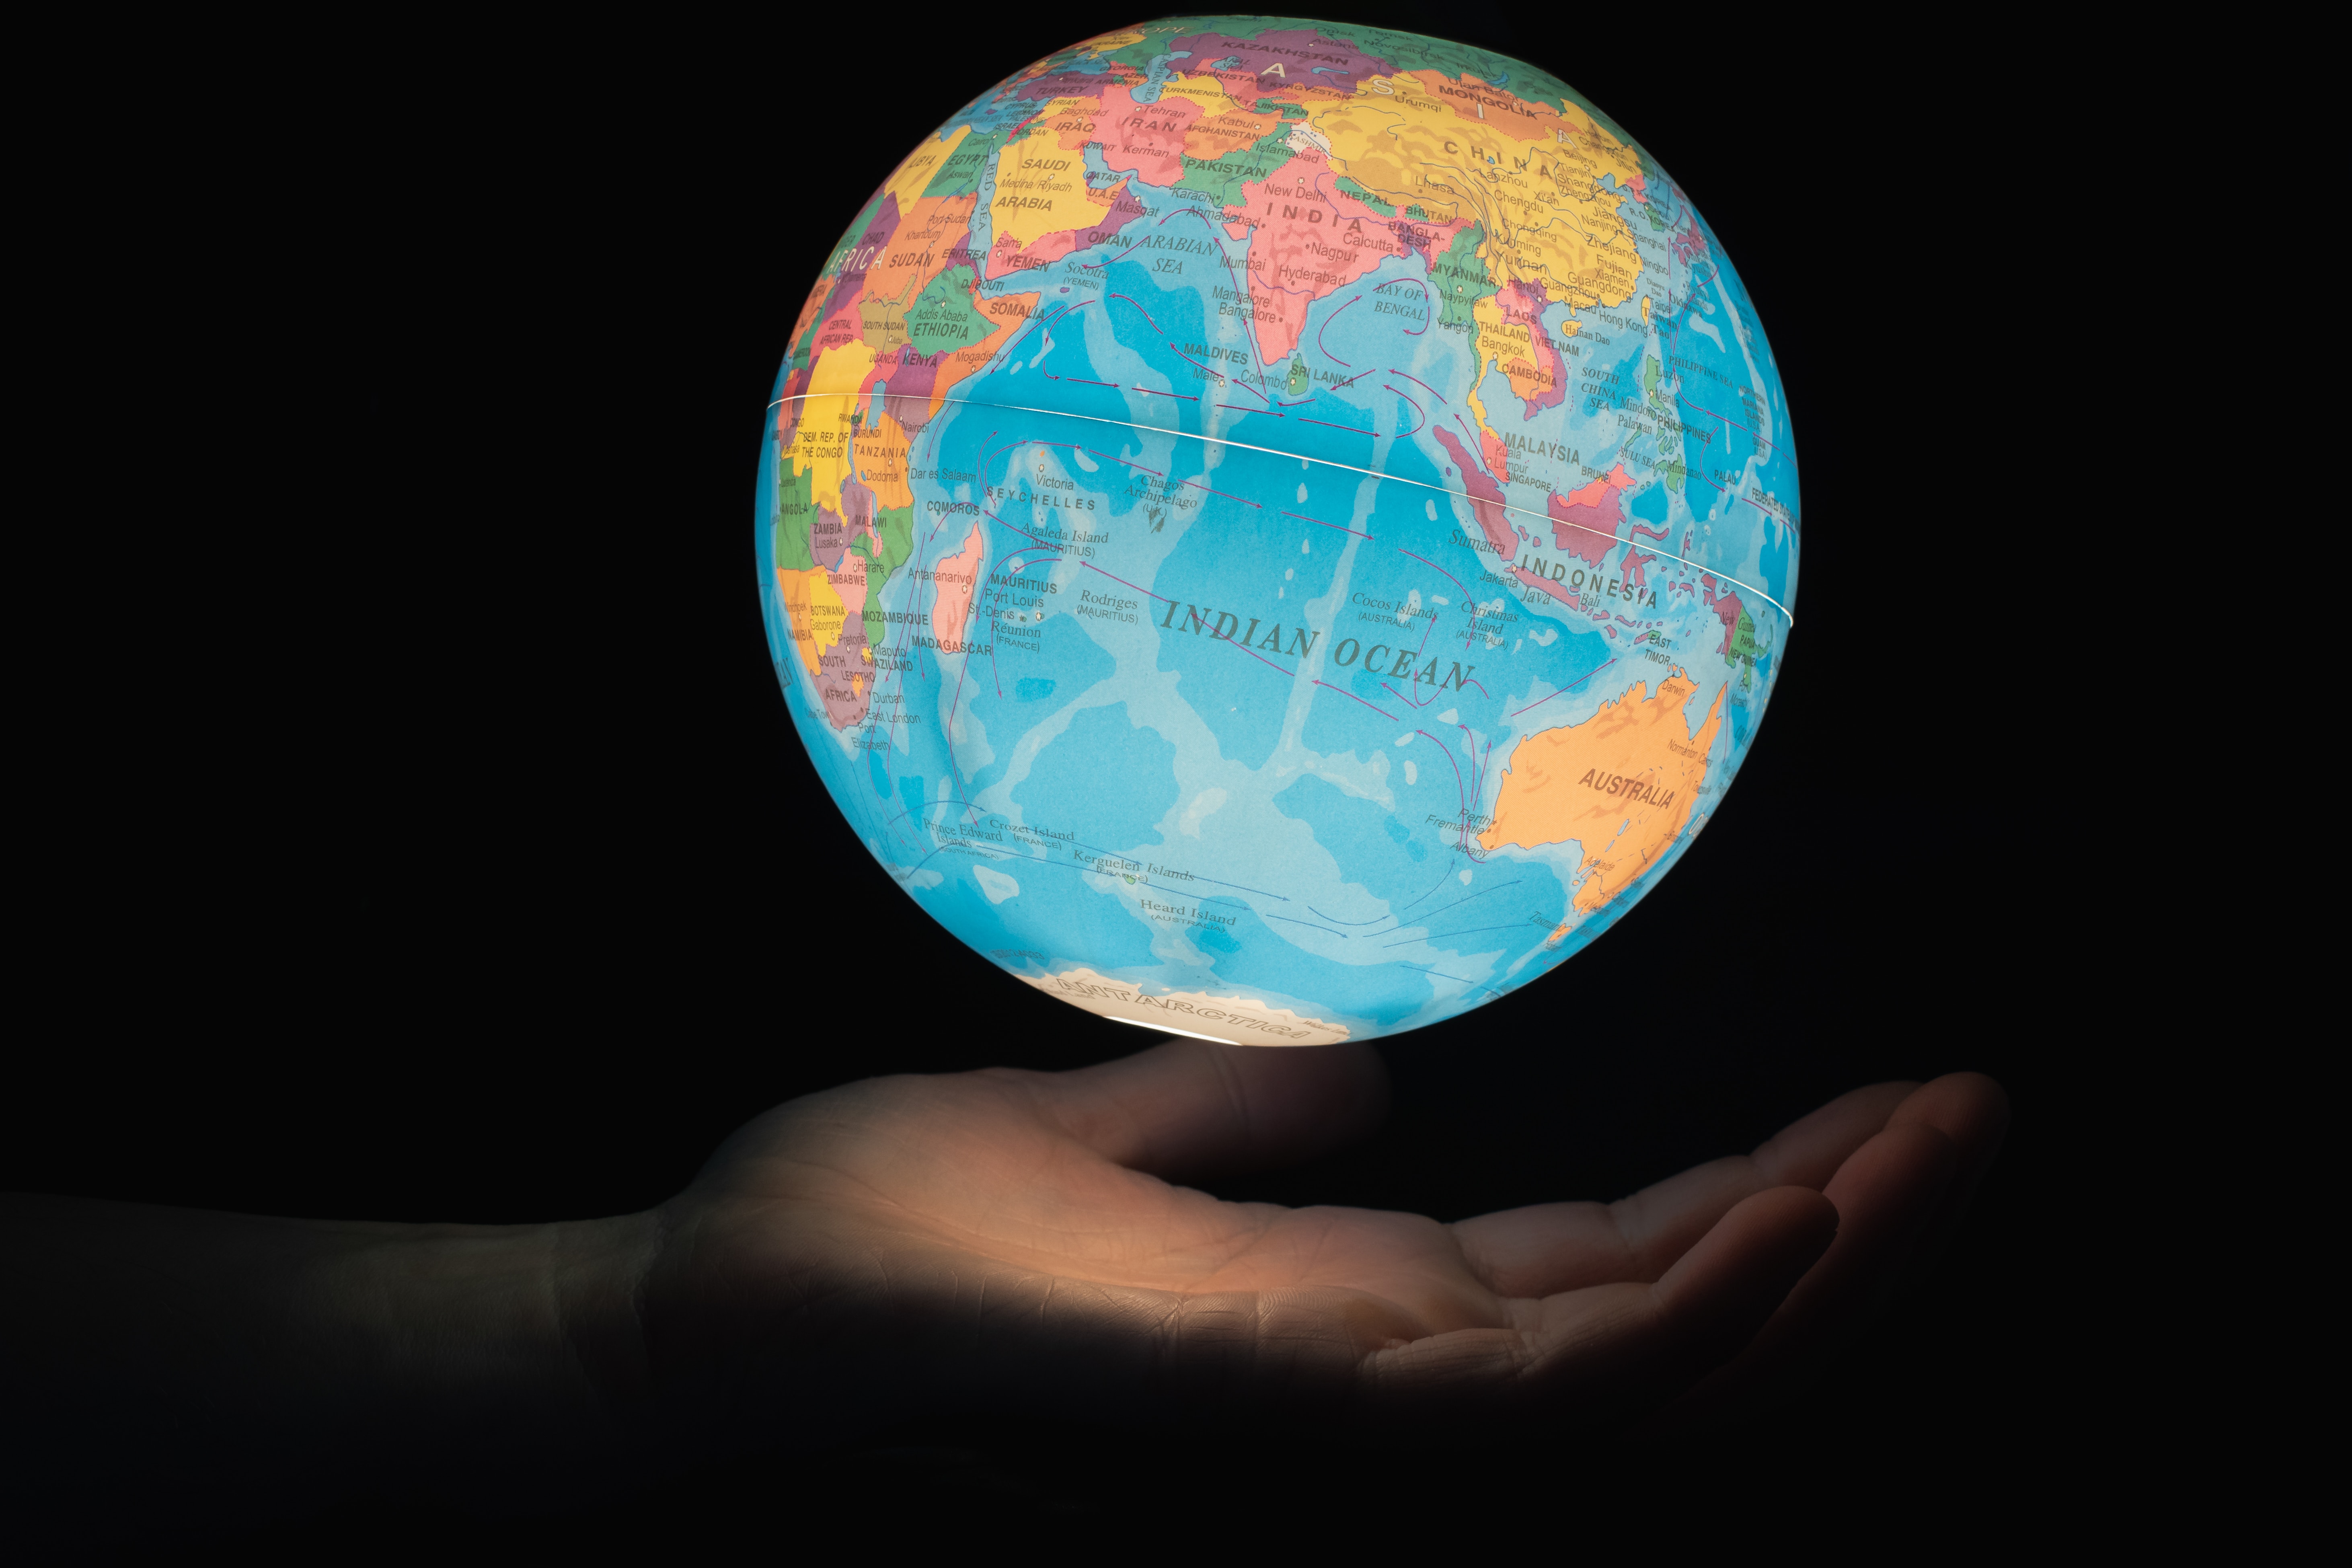
Map Projections: Understanding the Distortions
Map projections are a fundamental aspect of cartography, allowing us to represent the Earth's three-dimensional surface on a two-dimensional plane. However, due to the inherent differences between a sphere and a flat surface, distortions are inevitable.
To accurately depict the Earth's surface, various map projections have been developed, each prioritizing different aspects like area, shape, distance, or direction.
Different projections are suitable for different applications, and cartographers carefully choose the most appropriate one based on the purpose of the map.
Let’s take a look at a few.
Mercator Projection
The Mercator projection, created by Gerardus Mercator in the 16th century, is a cylindrical map projection.
It preserves angles and shapes, making it exceptionally useful for navigation and sea travel. However, it greatly distorts areas, particularly as you move towards the poles.
This projection became widely used for world maps, especially in the age of exploration, due to its utility for maritime navigation. Sailors could plot straight-line courses on it, simplifying their journeys.
Despite its popularity, the Mercator projection has faced criticism for its significant distortion of land masses, especially at higher latitudes.
Robinson Projection
The Robinson projection, developed by Arthur H. Robinson in 1963, is an attempt to balance map distortions.
It's an example of a pseudocylindrical projection, aiming to minimize distortions in area, shape, distance, and direction.
The projection presents a more accurate representation of the Earth's overall shape compared to the Mercator projection.
The Robinson projection is frequently used in world maps for educational purposes and general reference, where a compromise between different aspects of accuracy is essential. It's especially popular in thematic and general-purpose world maps.
Azimuthal Projections
Azimuthal projections are projections that preserve directionality from a central point to all other points on the map. These projections are particularly useful for applications where maintaining accurate directions from a central location is vital.
Common azimuthal projections include the Gnomonic and Lambert azimuthal equal-area projections.
Azimuthal projections find applications in navigation, meteorology, astronomy, and other fields where preserving directions from a specific point, often the North Pole or the South Pole, is critical.
Advantages and Limitations of Different Map Projections
Each map projection has its set of advantages.
- The Mercator projection excels in preserving angles and shapes, making it ideal for navigation. It's easy to use and understand, particularly for sailors, and allows for convenient route planning.
- The Robinson projection strikes a balance between various aspects of accuracy, presenting a more faithful representation of the Earth's features across the map. It's suitable for general-purpose world maps, providing a compromise in distortion.
- Azimuthal projections preserve accurate directions from a central point, facilitating applications like air travel, astronomy, and polar exploration.
However, every map projection comes with inherent limitations.
- The Mercator projection significantly distorts areas, particularly towards the poles, making it unsuitable for representing landmasses accurately. It exaggerates sizes, leading to misinterpretations of continents' true proportions.
- The Robinson projection, while a compromise, still involves distortions. It sacrifices accuracy in specific aspects, like shape, for a more balanced representation, making it less suitable for precise scientific or navigational applications.
- Azimuthal projections suffer from distortions away from the central point, making them less useful for depicting a global view with accuracy. They are best suited for specialized applications where maintaining precise directions from a central location is critical.

Types of Maps in Cartography
Cartography, the science and art of mapmaking, plays a pivotal role in creating and designing various map types. Cartographers utilize their expertise to ensure that maps are accurate, informative, and visually appealing.
They translate complex geographical data into accessible visual representations, aiding in better understanding and interpretation.
In the digital age, cartography has seen a revolution. Advanced Geographic Information Systems (GIS) technology allows cartographers to create interactive and dynamic maps.
GIS software enables the integration of diverse data sources, facilitating the creation of multifaceted, informative maps for a variety of purposes.
Evolution of Map Design and Technology
The evolution of map design and technology has transformed how we perceive and interact with maps. Traditionally, maps were hand-drawn or printed on paper, limiting their interactivity and real-time updates.
With the advent of computers and digital mapping tools, cartographers can now create highly detailed and accurate maps using specialized software.
Digital maps are dynamic and interactive, allowing users to zoom in and out, overlay different data layers, and access real-time information.
Geographic Information Systems (GIS) technology has played a significant role in this evolution, empowering cartographers to integrate complex data and create maps that cater to specific needs and applications.
How Cartographers Adapt to Changing Needs and Technology
Cartographers continually adapt to evolving needs and technological advancements. They stay updated with the latest software and tools, enhancing their capabilities to create innovative and interactive maps.
Moreover, cartographers collaborate with experts from various fields to ensure that the maps they create meet specific requirements and accurately convey information.
The changing landscape of technology and the increasing availability of geospatial data have necessitated a shift toward digital mapping and Geographic Information Systems (GIS).
Cartographers now harness the power of big data, machine learning, and artificial intelligence to develop sophisticated maps that aid decision-makers, researchers, and the general public in understanding the world around them.
A New Age of Mapping with MixPlaces
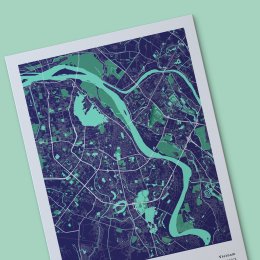
Here at MixPlaces, we're all about helping you create brand new maps unlike any ever seen before. But instead of portraying important streets to government infrastructure, our street maps are made to help you remember significant places and events.
Our star maps are not to help astronomers keep track of celestial bodies, but rather to immortalize your best and most heartfelt memories in the cosmos above us.
And the best part is, making our maps is much easier than reading one. All you need to do is head to our builder, choose your location(s), and customize your map's colors, layouts, elements, and texts to your heart's content!
Before you know it, you'll have a one-of-a-kind map made by you and for you in minutes.

Frequently Asked Questions About Types of Maps
Identifying Map Types in Images
Identifying map types in images involves recognizing specific visual cues and elements. For instance, political maps will have clearly defined borders and country names, while physical maps will depict geographical features like mountains, rivers, and forests.
Classifying Maps by Purpose and Content
Maps can be classified by their purpose, which might include navigation, education, analysis, or planning. On the other hand, they can be classified by their content, such as political boundaries, natural features, demographic data, or climate information.
Understanding the Three Main Categories of Maps
Understanding the three main map categories involves recognizing their fundamental purposes. General purpose maps provide a broad overview of geographic features, cartometric maps emphasize precise geometric accuracy, and thematic maps focus on specialized themes or subjects using visual representation of data.
The Role of Maps as a Graphical Representation Tool
Maps serve as powerful graphical representation tools, aiding in the visualization of complex data and information. Their graphical nature enables us to understand spatial relationships, patterns, and trends, making them invaluable for effective communication and decision-making.
Recap: The World of Maps
In this comprehensive guide, we've explored the diverse world of maps, ranging from political and physical maps to specialized thematic maps. Each type of map serves a unique purpose, providing us with valuable insights into the world we inhabit.
As technology advances and our understanding of the world deepens, maps will continue to evolve. From traditional paper maps to dynamic, interactive digital maps, their relevance remains undiminished.
Maps will remain indispensable tools, guiding us through an ever-changing world and helping us navigate the complexities of our planet.


